In this comprehensive guide, we will delve into the world of traceroute, a vital network diagnostic tool that helps users understand the journey of data packets across the network. We’ll begin by defining traceroute and exploring its purpose, followed by an overview of how it works and the basic process involved. To empower you with the necessary skills, we’ll provide a step-by-step guide on reading traceroute outputs and discuss common response types and their respective actions.
Additionally, we will cover the usage of traceroute across various platforms, including Windows, Linux, and Mac, complete with command examples and output illustrations.
Furthermore, we’ll examine how traceroute can be employed to diagnose network issues and wrap up our discussion by highlighting its limitations and important considerations. Join us as we unfold the intricacies of this indispensable tool for network troubleshooting and optimization.
What is Traceroute?
Traceroute is a command-line utility that helps you determine the route taken by packets across an IP network. By tracing the path of a packet from the source to the destination, you can identify potential bottlenecks, misconfigurations, or other network issues.
Available on most operating systems, traceroute is called traceroute on Linux and macOS, and tracert on Windows.
What Does Traceroute Do?
Traceroute is a network diagnostic tool that helps you determine the route taken by packets across an IP network. It’s great for identifying potential bottlenecks, misconfigurations, or other network issues.
How Does Traceroute Work: The Basics
Traceroute operates by sending a series of packets with incrementing Time-to-Live (TTL) values. As the TTL value decreases with each hop, routers return an “ICMP Time Exceeded” message, which traceroute uses to map the path.
Here’s a high-level overview of how traceroute works:
- Initialize: The source sends the first packet with a TTL value of 1.
- Increment TTL: The TTL value is increased by 1 for each subsequent packet.
- Receive ICMP Messages: Routers return “ICMP Time Exceeded” messages as the TTL expires.
- Record Hop Information: Traceroute records the IP address and latency of each hop.
- Repeat: Steps 2-4 are repeated until the destination is reached or the maximum TTL is exceeded.
To run traceroute, use the following command:
For Linux and Mac users:
traceroute google.com
Or, for Windows users:
tracert google.com
Basic Process of Traceroute
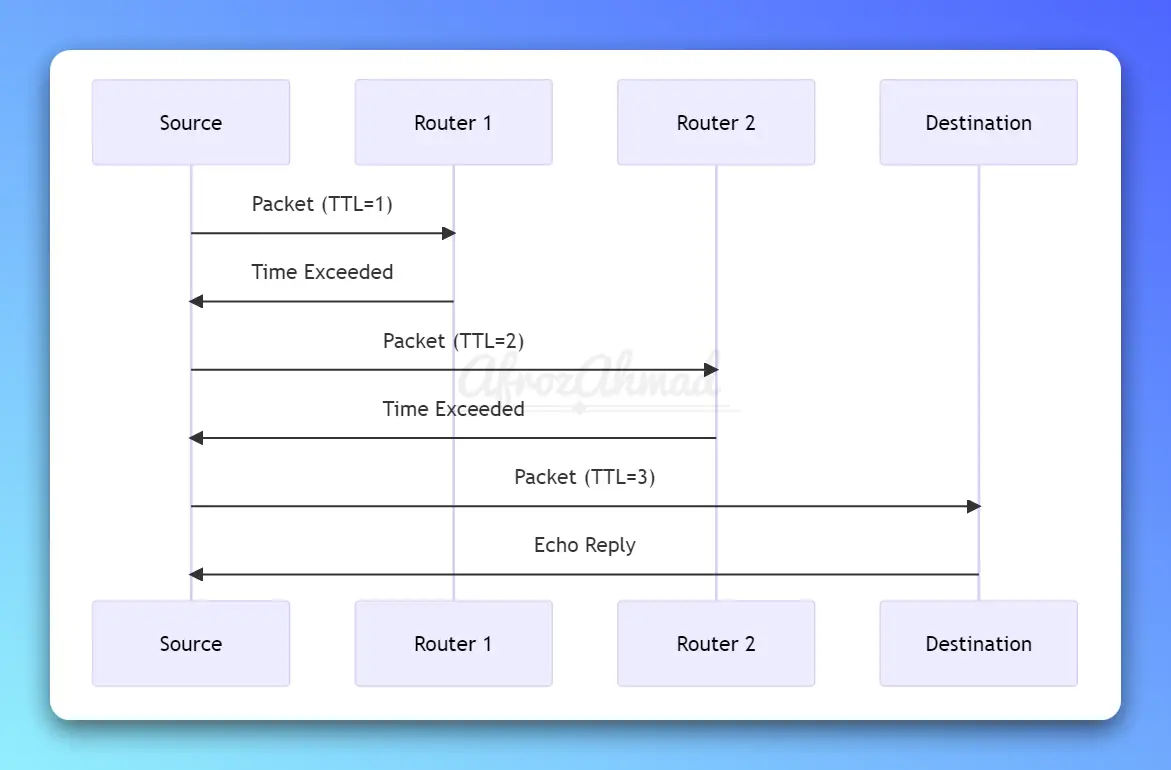
Let’s understand the basic process of traceroute with a diagram:-
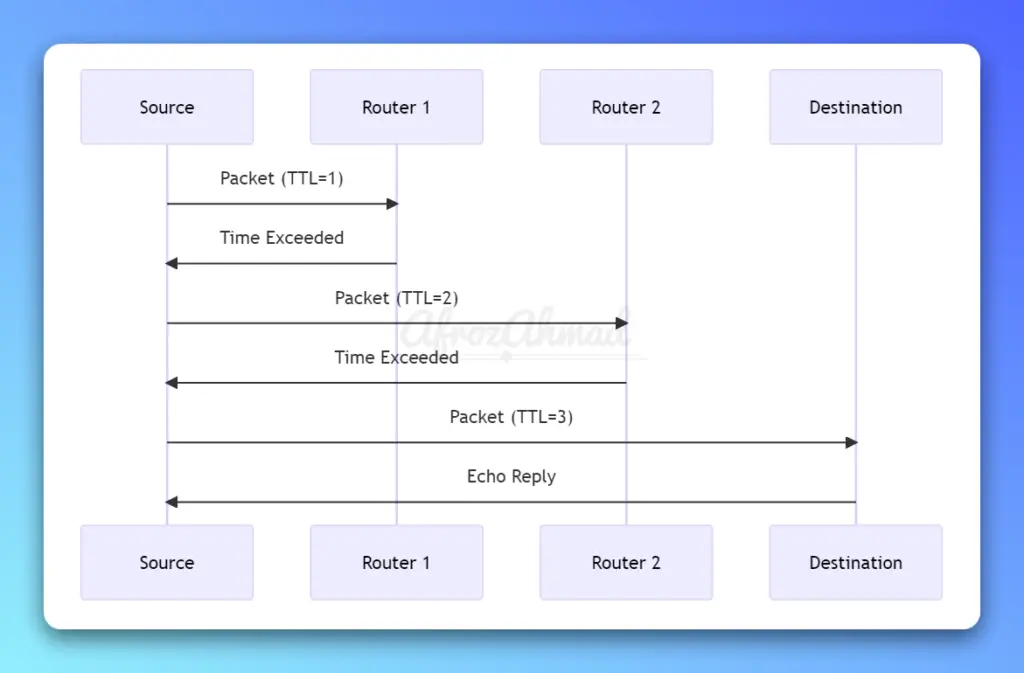
The above diagram represents the interaction between a Source (S), two intermediate routers (R1 and R2), and the Destination (D) during a simplified traceroute process.
Here’s a step-by-step explanation of what is going on in the diagram:
- The Source (S) sends a packet with a TTL (Time to Live) value of 1 to Router 1 (R1).
- Router 1 (R1) decrements the TTL value by 1, resulting in a TTL of 0. As the TTL has reached 0, R1 sends a “Time Exceeded” message back to the Source (S) without forwarding the packet to the next hop.
- The Source (S) increments the TTL value by 1 and sends another packet with a TTL value of 2 to Router 1 (R1).
- Router 1 (R1) decrements the TTL value by 1, resulting in a TTL of 1, and forwards the packet to Router 2 (R2).
- Router 2 (R2) decrements the TTL value by 1, resulting in a TTL of 0. As the TTL has reached 0, R2 sends a “Time Exceeded” message back to the Source (S) without forwarding the packet to the next hop.
- The Source (S) increments the TTL value again and sends another packet with a TTL value of 3 to Router 1 (R1).
- Router 1 (R1) decrements the TTL value by 1 and forwards the packet to Router 2 (R2) with a TTL of 2.
- Router 2 (R2) decrements the TTL value by 1 and forwards the packet to the Destination (D) with a TTL of 1.
- The Destination (D) receives the packet and sends an “Echo Reply” message back to the Source (S) to indicate that the packet has reached its destination.
This sequence diagram visually represents the process of sending packets with increasing TTL values and the corresponding ICMP responses in a traceroute. It helps to understand the interactions between the source, routers, and destination during the traceroute process.
How to read traceroute? – Understanding Traceroute Output
The traceroute’s output consists of a series of lines, each representing a hop in the route. Here’s an example of what you might see:
traceroute google.com
1 192.168.1.1 (192.168.1.1) 1.123 ms 1.098 ms 1.075 ms
2 203.0.113.1 (203.0.113.1) 10.123 ms 11.098 ms 12.075 ms
Each line contains the following information:
- Hop number: The position of the router in the route (e.g., “1”, “2”).
- IP address: The IP address of the router (e.g., “192.168.1.1”, “203.0.113.1”).
- Latency: The round-trip time for the packet to reach the router and return, measured in milliseconds (e.g., “1.123 ms”, “10.123 ms”).
Common response types for traceroute and their respective actions:
Here is a table summarizing the common response types for traceroute and their respective actions:
| Response Type | Description | Action |
|---|---|---|
| Time Exceeded | The packet’s TTL reached 0 before reaching the destination. | Display hop information and increment the TTL. |
| Echo Reply | The packet reached the destination. | Display the final route and exit traceroute. |
| Destination Unreachable | The packet could not reach the destination due to a routing issue or other network problem. | Display the error information and decide whether to continue or exit traceroute. |
| Source Quench | A request to reduce the sending rate to avoid congestion. | Consider reducing the sending rate and decide whether to continue or exit traceroute. |
| Redirect | Indicates that a better route is available. | Display the error information and decide whether to continue or exit traceroute. |
| Other/Error | Any other ICMP response type or an error occurred. | Display the error information and decide whether to continue or exit traceroute. |
These response types represent the different ICMP messages that can be received during a traceroute process. The action taken in response to each message type allows the traceroute to gather information about the network path and make decisions on whether to continue or exit the process.
How to Use Traceroute for Windows (With Command and Output Example)
For Windows users, the command is slightly different – it’s called tracert.
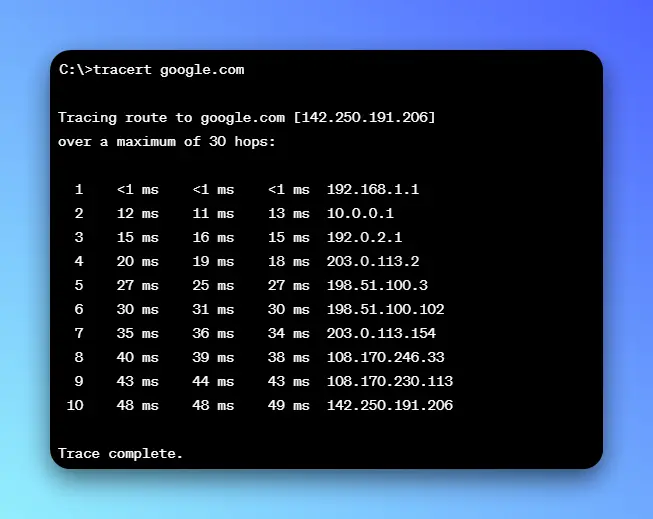
Here’s how to use traceroute on a Windows box:
- Open the Windows search box and type “CMD” into the search bar. Then open the Command Prompt app and type in “tracert” followed by a space and then the destination URL or IP address. Finally, hit Enter.
Here is how it looks on a Windows PC.
How to Use Traceroute for Linux (With Command and Output Example)
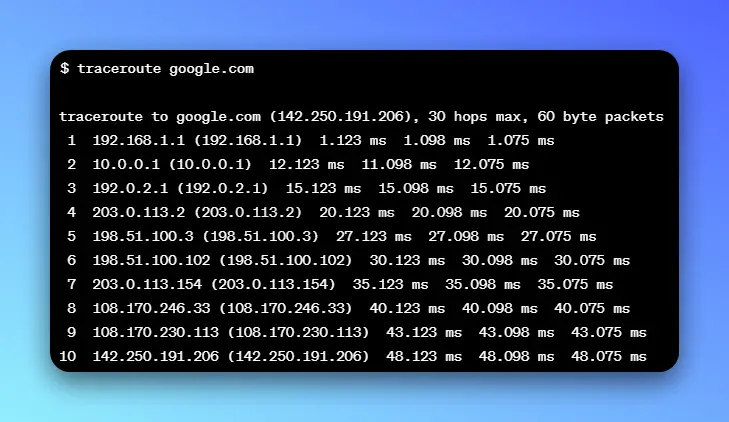
Traceroute is a built-in command-line tool on Linux systems that can help you diagnose network connectivity issues. Here’s how to use traceroute on Linux:
- Open a terminal window on your Linux system.
- Type “traceroute” followed by the IP address or hostname of the destination server you want to test. For example, to test the connection to Google.com, you would type:
- traceroute google.com
- Press Enter to run the command. The traceroute tool will begin sending packets to the destination server and displaying information about each hop along the way.
Here is how it looks on a Linux PC.
How to Use Traceroute for Mac (With Command and Output Example)
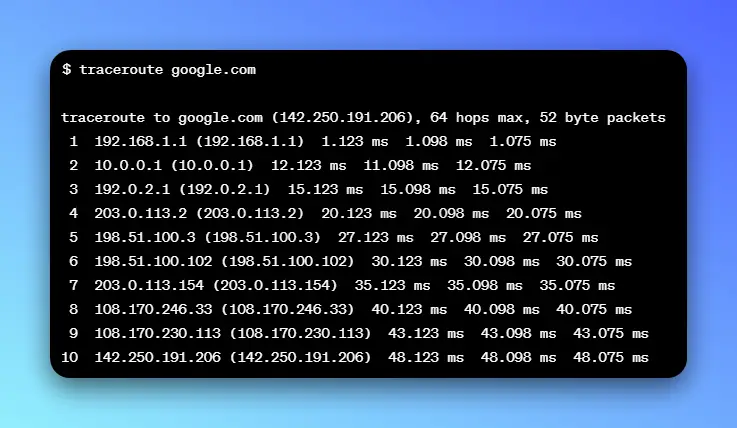
Traceroute is a built-in command-line tool on macOS that can help you diagnose network connectivity issues. Here’s how to use traceroute on a Mac Machine:
- Open the Terminal app on your Mac. You can find it in the Utilities folder within the Applications folder, or you can search for it using Spotlight (the magnifying glass icon in the top-right corner of the screen).
- Type “traceroute” followed by the IP address or hostname of the destination server you want to test. For example, to test the connection to Google.com, you would type:
- traceroute google.com
- Press Enter to run the command. The traceroute tool will begin sending packets to the destination server and displaying information about each hop along the way.
Here is how it looks on a Mac PC.
How to use Traceroute to Diagnose Network Issues?
Traceroute is helpful for diagnosing a variety of network issues, including:
- High latency: If latency increases significantly at a specific hop, there may be a bottleneck or congestion.
- Routing loops: If traceroute displays the same IP address multiple times, a routing loop may be present.
- Incomplete paths: If traceroute does not reach the destination, there may be a routing issue, a firewall blocking the request, or the destination might be down.
To help diagnose issues, consider the following:
- Compare multiple traceroutes: Run traceroute from different sources to see if the issue is consistent or isolated.
- Analyze latency patterns: Look for patterns in latency, such as consistently high latency at specific hops or sudden spikes in latency.
- Check for packet loss: If some packets are not returned, it could indicate packet loss, which may impact the network’s performance.
Limitations and Considerations
While traceroute is a powerful tool, it’s essential to understand its limitations:
- Firewalls and security devices: Some devices may block or filter ICMP packets, leading to incomplete or misleading traceroute results.
- Asymmetrical routing: Traceroute only shows the path from the source to the destination, not the reverse path, which could differ due to asymmetrical routing.
- Load balancing: If a network uses load balancing, traceroute may show multiple paths or varying latency as packets are distributed across different routes.
Keep these considerations in mind when interpreting traceroute results, and use other network diagnostic tools (such as ping, mtr, and pathping) to complement and verify your findings.
Conclusion
Traceroute is a valuable tool for understanding the route taken by data packets and diagnosing network issues. By learning what a traceroute is and how it works, and how to interpret its output, you can better identify and resolve latency issues, routing loops, and incomplete paths. However, be mindful of the traceroute’s limitations and consider using additional tools to gain a more comprehensive view of your network’s performance.
- Best Routers for AT&T Fiber Internet (Tested for IP Passthrough) - March 26, 2026
- Best PoE Switches for Home Lab and Small Business (2026) - March 25, 2026
- Best Routers for T-Mobile Home Internet in 2026 (Tested Behind the Gateway) - March 19, 2026

